
Every morning there are a few hundred new CVEs. Almost none of them are mine. The whole job of vulnerability triage is throwing away the ones that don't touch anything I run, fast enough that I still have time to fix the ones that do. That's the job My Stack is supposed to do for me — so this is me actually using it on my own machines, screenshots and all, including the parts it gets wrong.
I'm the person who builds cve.tools, so treat this as dogfooding, not a demo. I fed it a scan of one real host plus a handful of internet-facing appliances — 29 products — and I'm going to show you the unedited result: the good matches, the too-broad ones, and the daily queue it hands me.
The problem I actually have
The database behind cve.tools holds hundreds of thousands of CVEs. On any given week a scanner or a feed will happily show me thousands that are technically about a vendor I run. That's not triage — that's a second firehose. What I want is the intersection of two small sets: what I actually run and what is actually being exploited right now. My Stack is the attempt to store the first set once and let the server keep computing the second.
What I put in — the 30-second version and the honest version
There are four ways to fill a stack: type a product name, star a vendor on a Trends page, click Watch on any CVE page, or import from the CLI (cvetools stack scan on a host, or cvetools stack import --sbom sbom.cdx.json). I did the honest thing for a real environment: I imported a host scan — which is where the operating-system packages below come from — and then typed in the handful of internet-facing appliances I care about by hand. The free tier caps you at 5 tracked products; I'm on the unlimited tier, which is why you'll see more than five here.
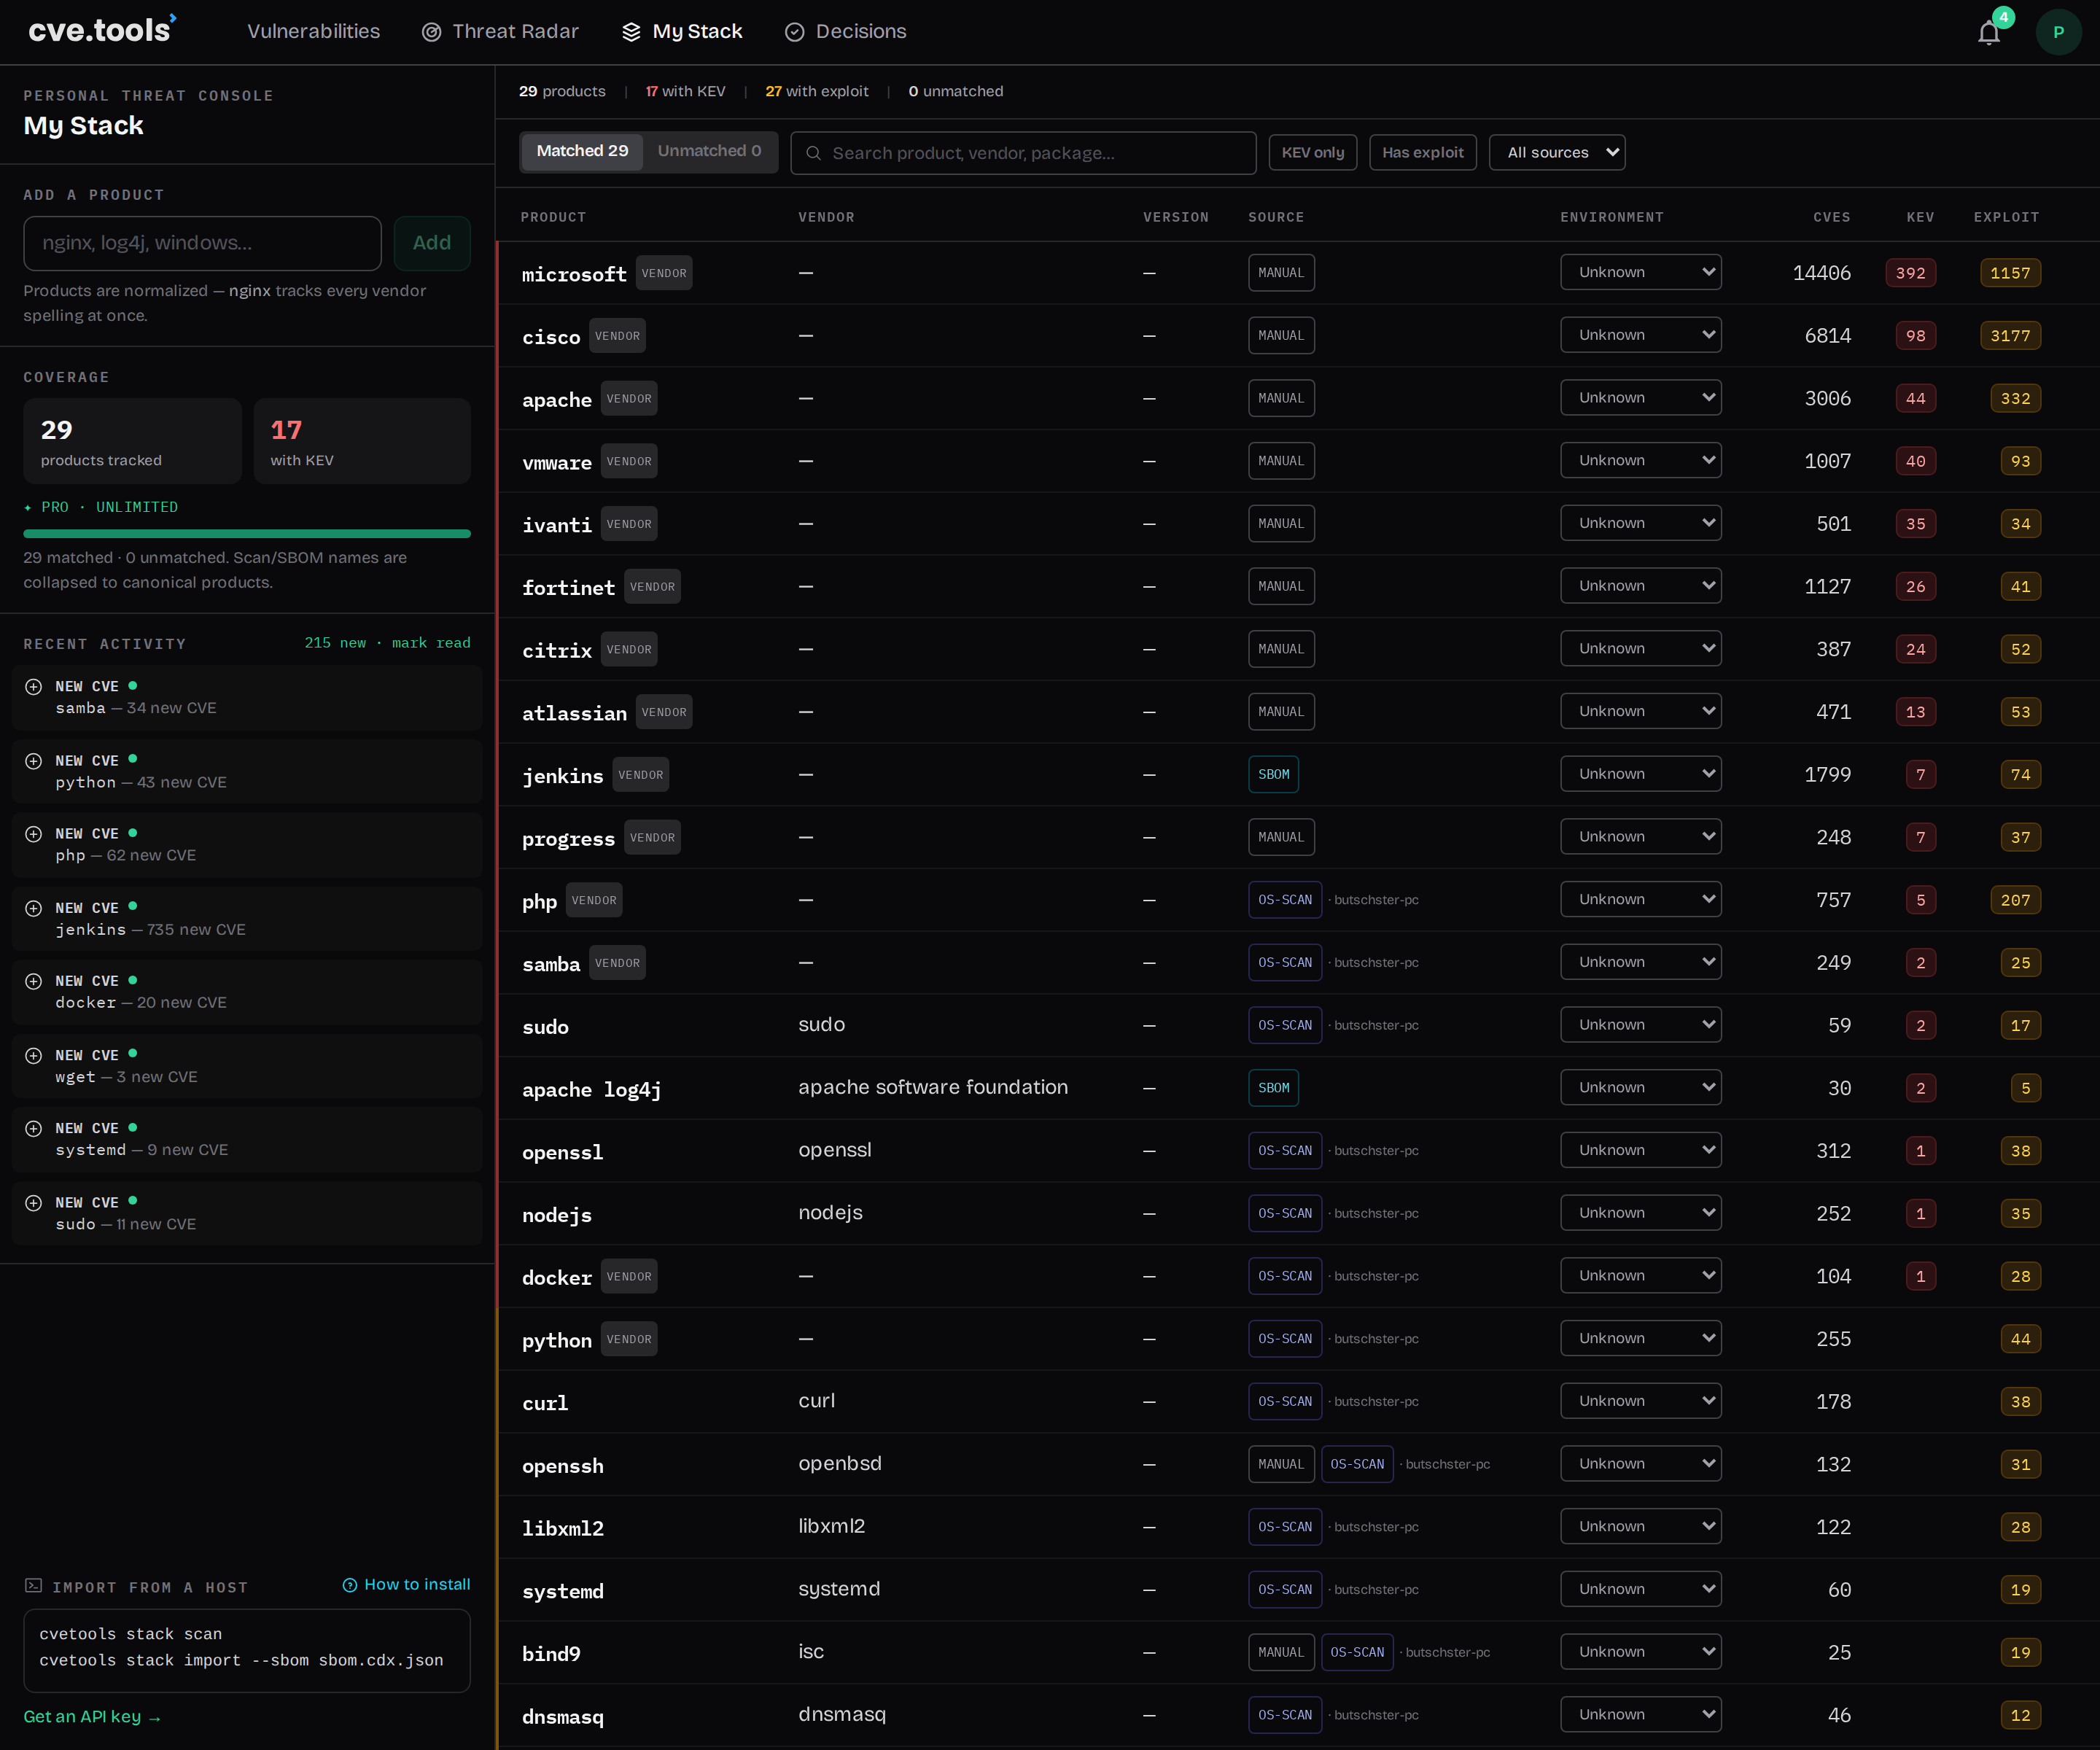
Two things matter in that screenshot. First, the SOURCE column: the operating-system packages (sudo, openssl, systemd, curl, openssh…) landed via a host scan, not manual entry — which is the only way this survives contact with a real environment of hundreds of packages. Second, normalization: I typed messy vendor strings and they collapsed to canonical products, so nginx tracks every vendor spelling of nginx at once and I don't maintain a synonym list.
What matched — and where it's honestly too broad
This is the part most tool write-ups would hide. Look at the CVE counts per product. apache log4j resolved to a canonical product and matched 30 CVEs, 2 of them on CISA KEV — tight and useful. But microsoft resolved to a vendor and matched 14,406 CVEs; cisco, 6,814. That's not the tool being clever, that's me handing it a vendor name with no product or version and getting back everything that vendor ever shipped a bug for.
The part I actually use every day: Decisions
A list of matched CVEs is still too long to be a plan. The Decisions view applies a cut-line policy — mine is act on CISA KEV, or a public exploit, or EPSS ≥ 50% — and splits every matched CVE into ACT vs DEFER. High CVSS alone does not force ACT; exploitation does. Every decision freezes the policy and the risk snapshot at the moment I made it, so the DEFER pile isn't me ignoring things — it's a timestamped, exportable record of why each one was safe to wait on.
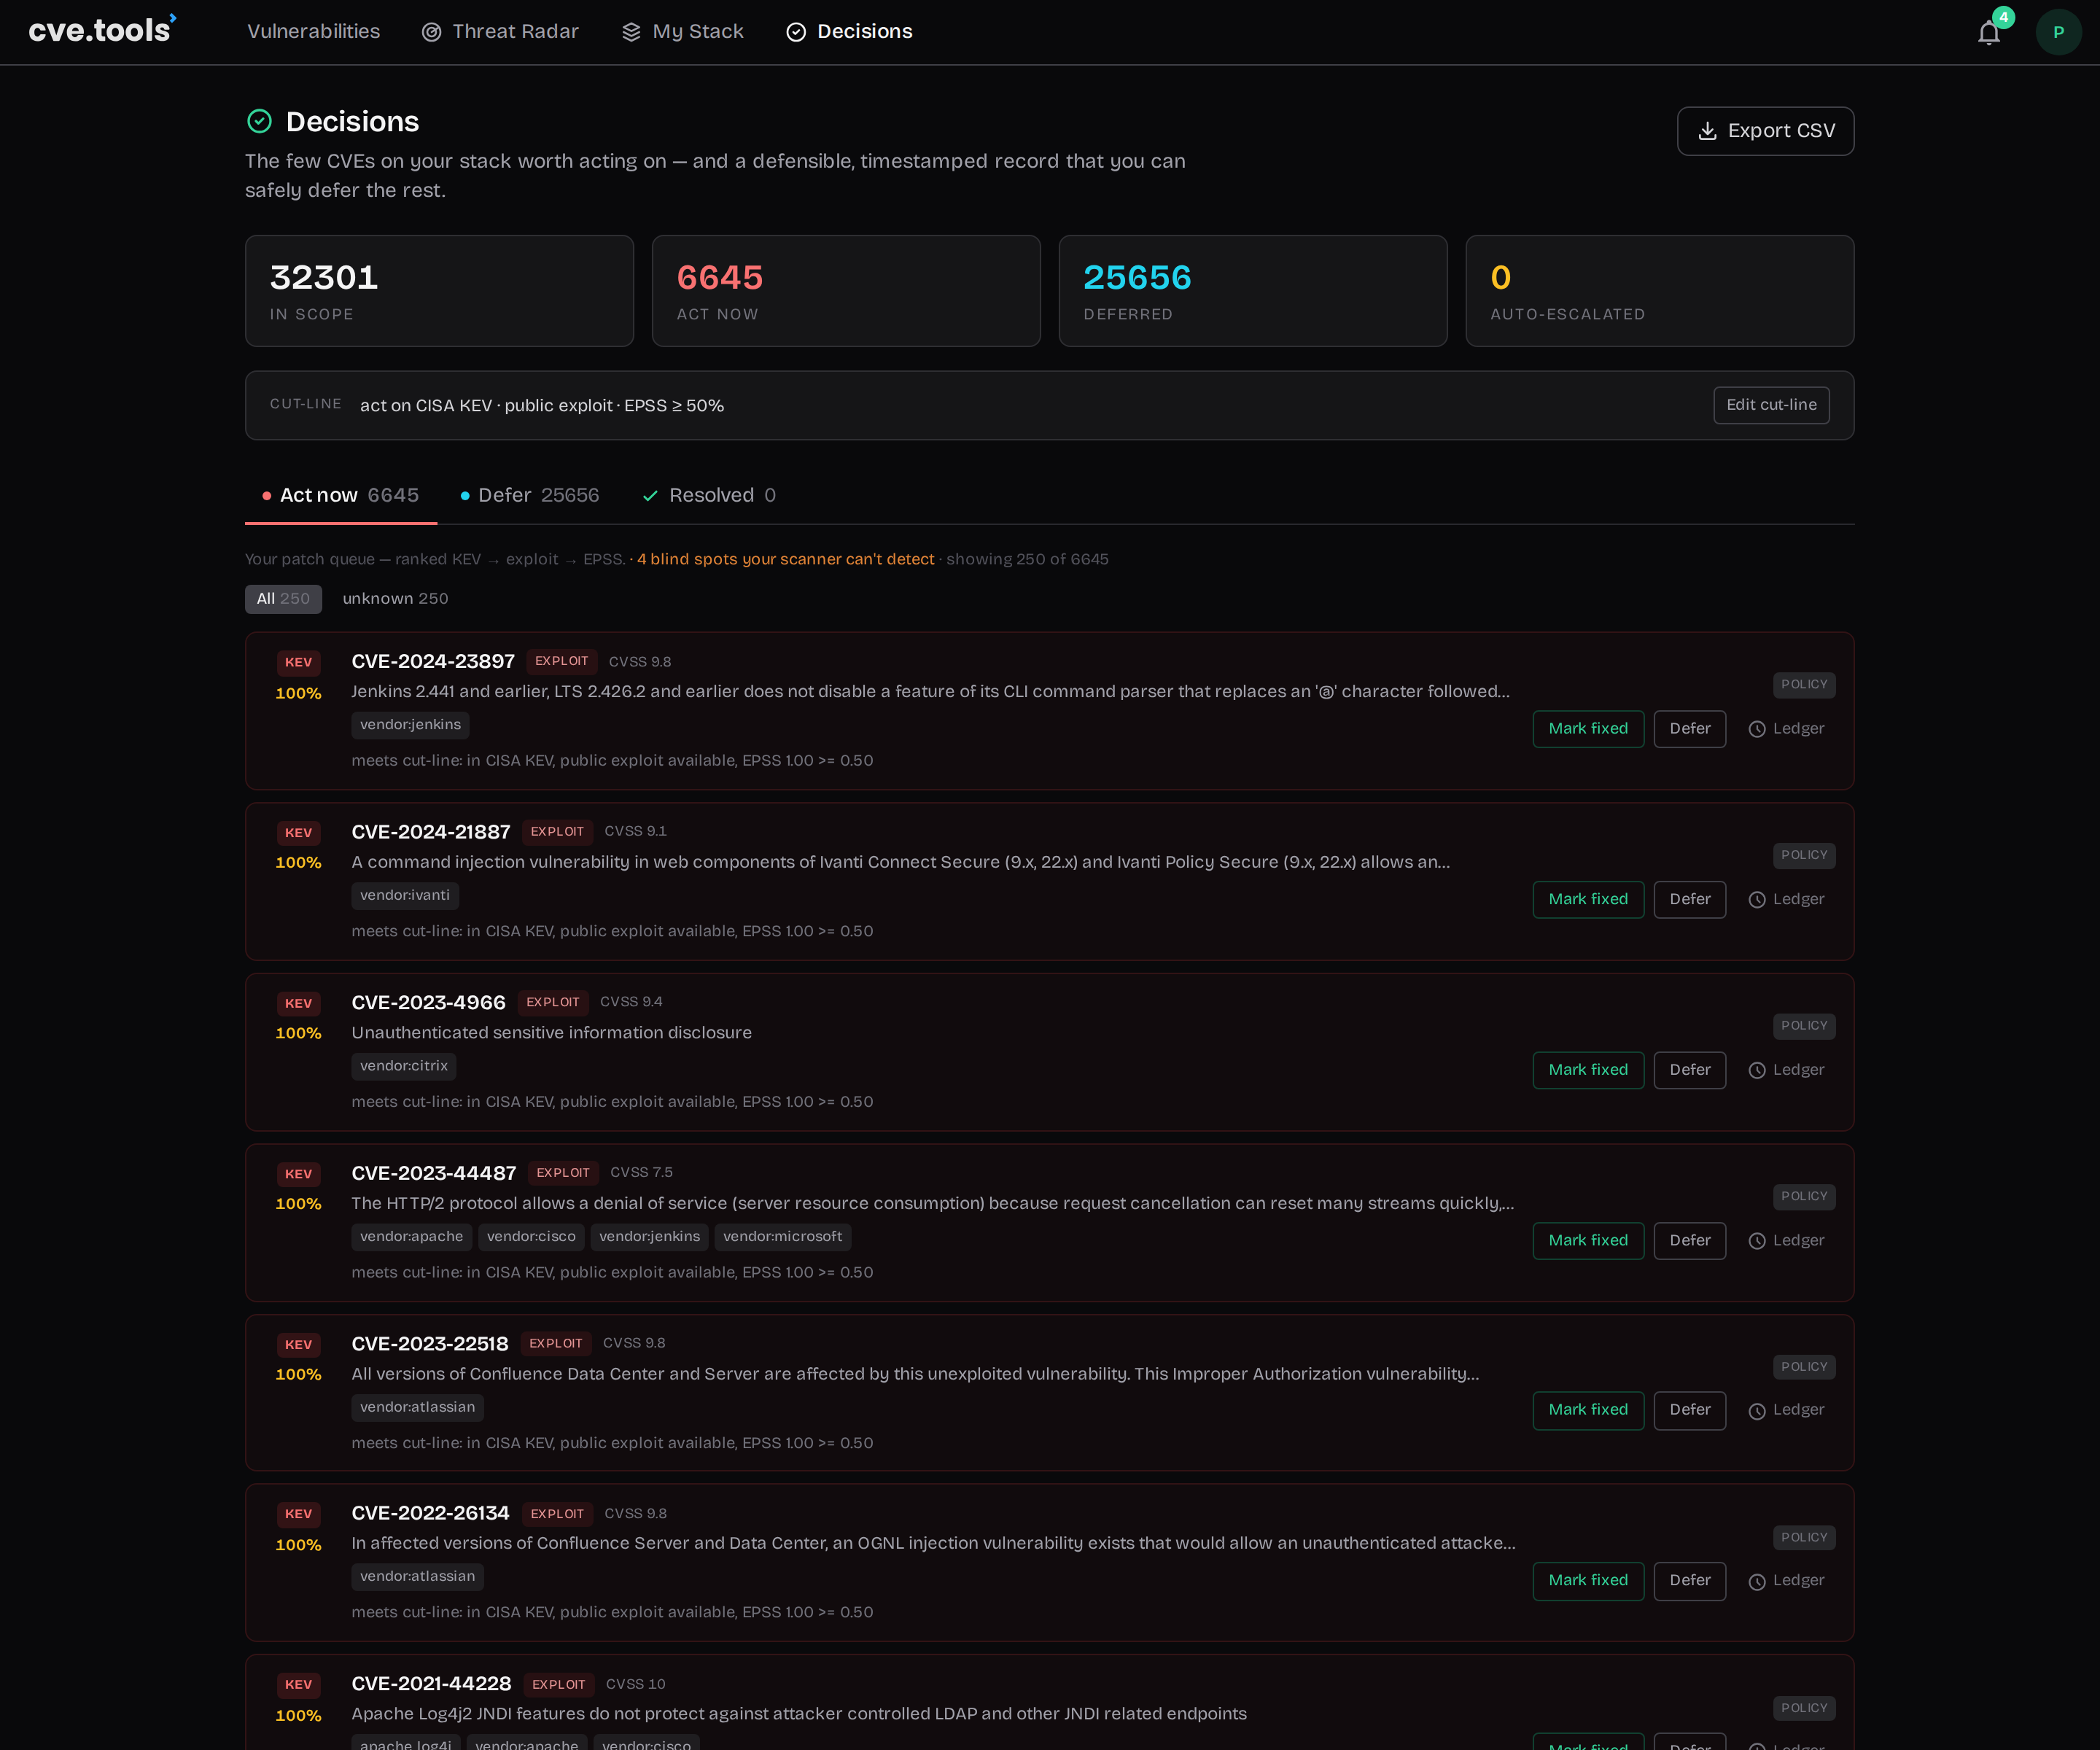
That 6,645 ACT count is inflated by the vendor-level watches I just complained about — narrow the stack with versions and it drops hard. But two numbers on that page earn their keep regardless: the DEFER pile with a frozen reason on each item (the thing an auditor actually asks for), and the blind spots — 4 CVEs that clear my cut-line but have no scanner check available, so my scanner would never raise them. Those four are the whole point: they're what a scan-only workflow misses.
One CVE, start to finish
Concretely: apache log4j was in my stack from an SBOM. CVE-2021-44228 — Log4Shell, CVSS 10, on KEV, public exploit — matched the canonical product (not a vendor guess), cleared the cut-line on all three axes, and landed in ACT with the reason frozen: in CISA KEV, public exploit available, EPSS far above my 50% line. One click records the decision; the ledger keeps the receipt. That's the loop: a product I run → a real exploited bug → a defensible call I can point at later.
What brings me back: "since your last visit"
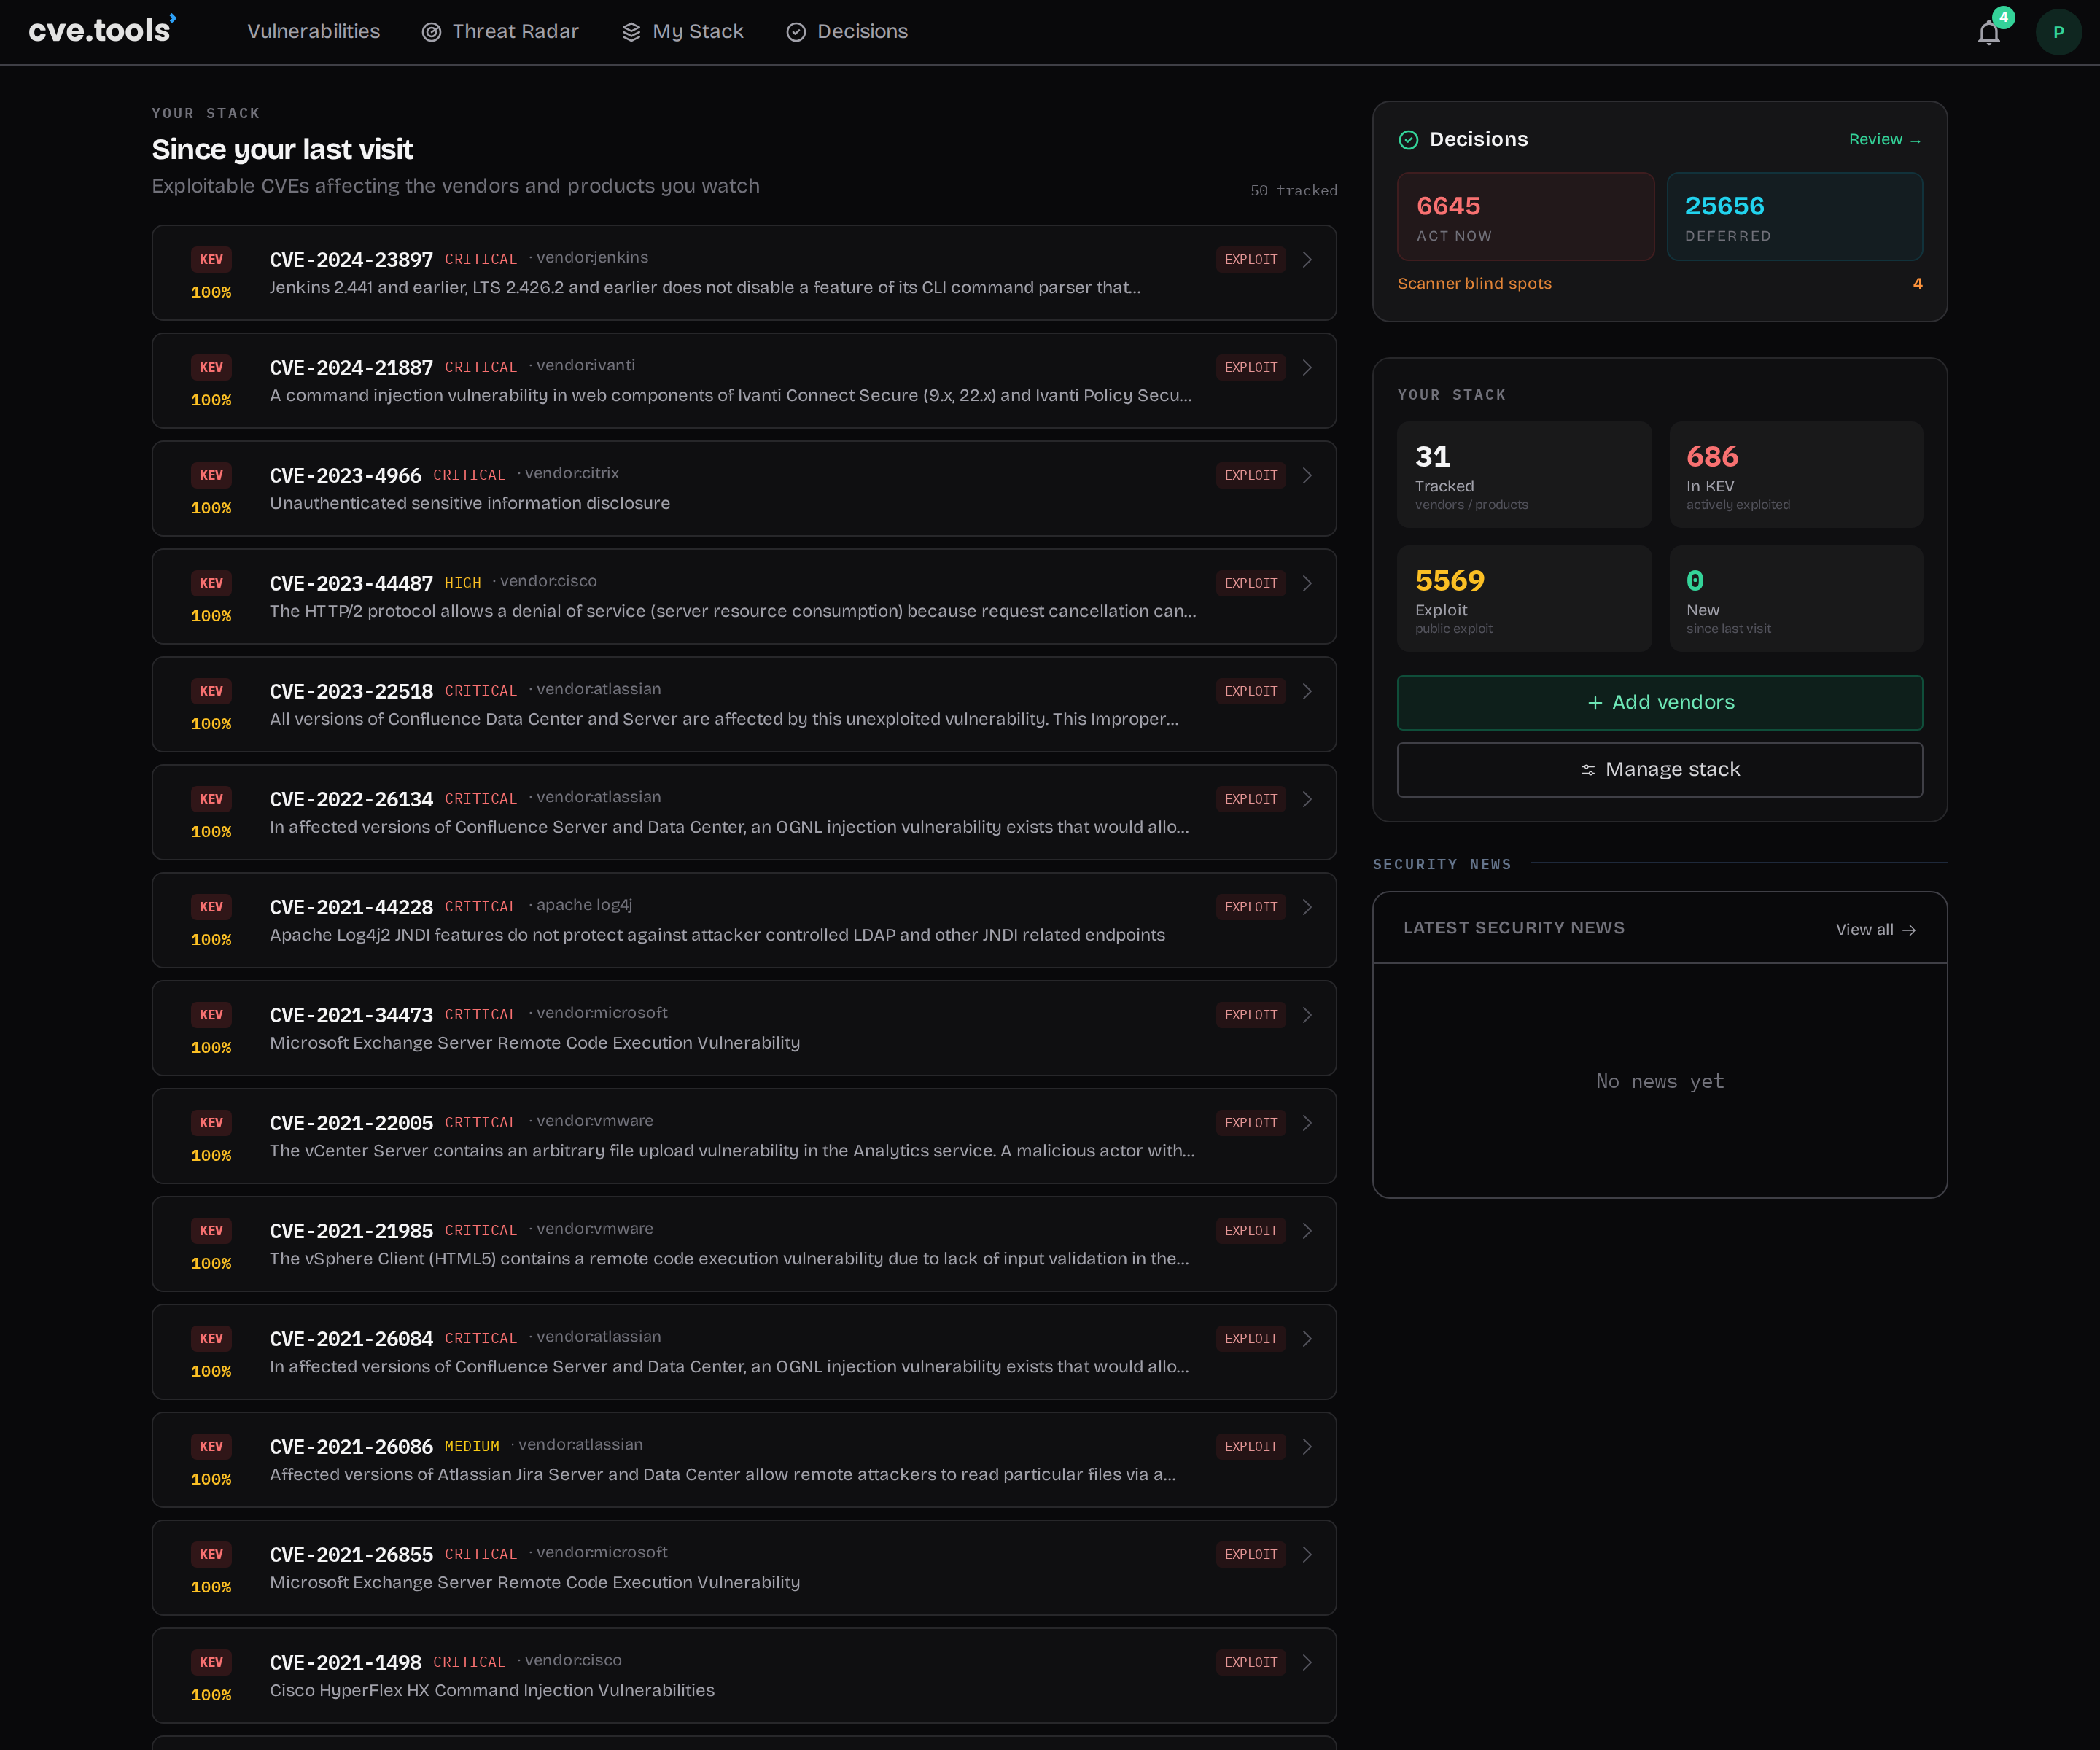
The dashboard leads with what changed on my stack since I last looked, and an hourly monitor diffs the KEV and exploit sets so "new" means new to me, not new to the world. When a KEV or a fresh exploit lands on something I track, a daily digest pushes it out — today that channel is Telegram (opt-in; you link it once), with more channels to come. The value lives in the push, not in me remembering to open a tab.
Where it falls short (so you don't have to find out yourself)
- It's a daily digest, not a pager. The feed updates hourly, the push is daily. For most patching cadences that's fine; if you need sub-hour alerting, this isn't it yet.
- Vendor-level watches are broad. Type only a vendor and you get a firehose. Import a scan or SBOM with versions if you want a real patch list.
- Manual typing does not scale. A real environment is hundreds of products across dozens of versions — that's what
cvetools stack scanand SBOM import are for. Typing is fine for a first taste, not for the whole fleet. - It does not replace a scanner. There's no version-level detection on your actual hosts unless you import it. This is a watch layer, not a scan.
- Coverage is bounded by normalization. Obscure or in-house software may not map to a canonical product yet — it'll sit as an unmatched entry until it does.
- Digest channel is Telegram-only today. Email and other channels are on the roadmap; if Telegram isn't an option for you, you'll be reading the feed on the site for now.
Who it's for — and who it isn't
My Stack vs. a vulnerability scanner
- Watches products you can't scan — SaaS, appliances, dev tooling, shadow IT
- Fires on the exploitation event (KEV/exploit added), not your scan cadence
- Free; product names only unless you import versions
- A defensible ACT/DEFER ledger for the few that matter
- Version-level detection on hosts it can actually reach
- Authoritative inventory of what's really installed
- Runs on your scan schedule
- Owns remediation tracking in your environment
So: if you already scan your fleet, My Stack is the layer that watches the things your scanner can't reach and tells you the morning a known-exploited bug lands on any of them. If you don't scan at all — a small team, a few internet-facing boxes — it's a cheap way to stop watching a dozen vendor advisory pages by hand. It complements a scanner; it does not replace one.